Hyperscalper is a professional cryptocurrency trading terminal I built for Hyperliquid DEX. What makes it unique is that it's fully client-side - no backend servers, no middlemen. Your private keys never leave your browser.
In this post, I'll walk through the key architectural decisions, the different order entry methods I implemented, and how the real-time market scanners work.
Why Fully Client-Side?
When building a trading application that handles private keys, trust is everything. I made a deliberate decision: zero backend.
The Trust Problem
Traditional trading platforms require you to trust them with your credentials. Even with the best security practices, there's always a server that could be compromised, a database that could be breached, or an employee who could go rogue.
With Hyperscalper, the data flow is simple:
Browser → Hyperliquid DEX API
That's it. No relay servers, no proxies, no backend databases.
How Private Keys Are Secured
Even though everything runs in the browser, I still needed robust encryption for the private key stored in localStorage. Here's the approach:
// AES-GCM encryption with PBKDF2 key derivationConst deriveKey = async (password: string, salt: Uint8Array) => {const keyMaterial = await crypto.subtle.importKey('raw',new TextEncoder().encode(password),'PBKDF2',false,['deriveBits', 'deriveKey']);return crypto.subtle.deriveKey({name: 'PBKDF2',salt,iterations: 100000, // Makes brute-force expensivehash: 'SHA-256'},keyMaterial,{ name: 'AES-GCM', length: 256 },false,['encrypt', 'decrypt']);};
The system generates a device-specific key on first use, stored in localStorage. Users can optionally add a password for additional protection. Even if someone steals the localStorage data, they'd need 100,000 PBKDF2 iterations to crack each guess.
The Tradeoffs
Going fully client-side has consequences:
- Zero trust required — but can't run server-side bots
- No data collection — but order history relies on exchange API
- True decentralization — but all computation happens in browser
- No server costs — but can't do heavy backtesting
For a scalping terminal where speed matters, these tradeoffs make sense. The latency between your browser and Hyperliquid is all that matters.
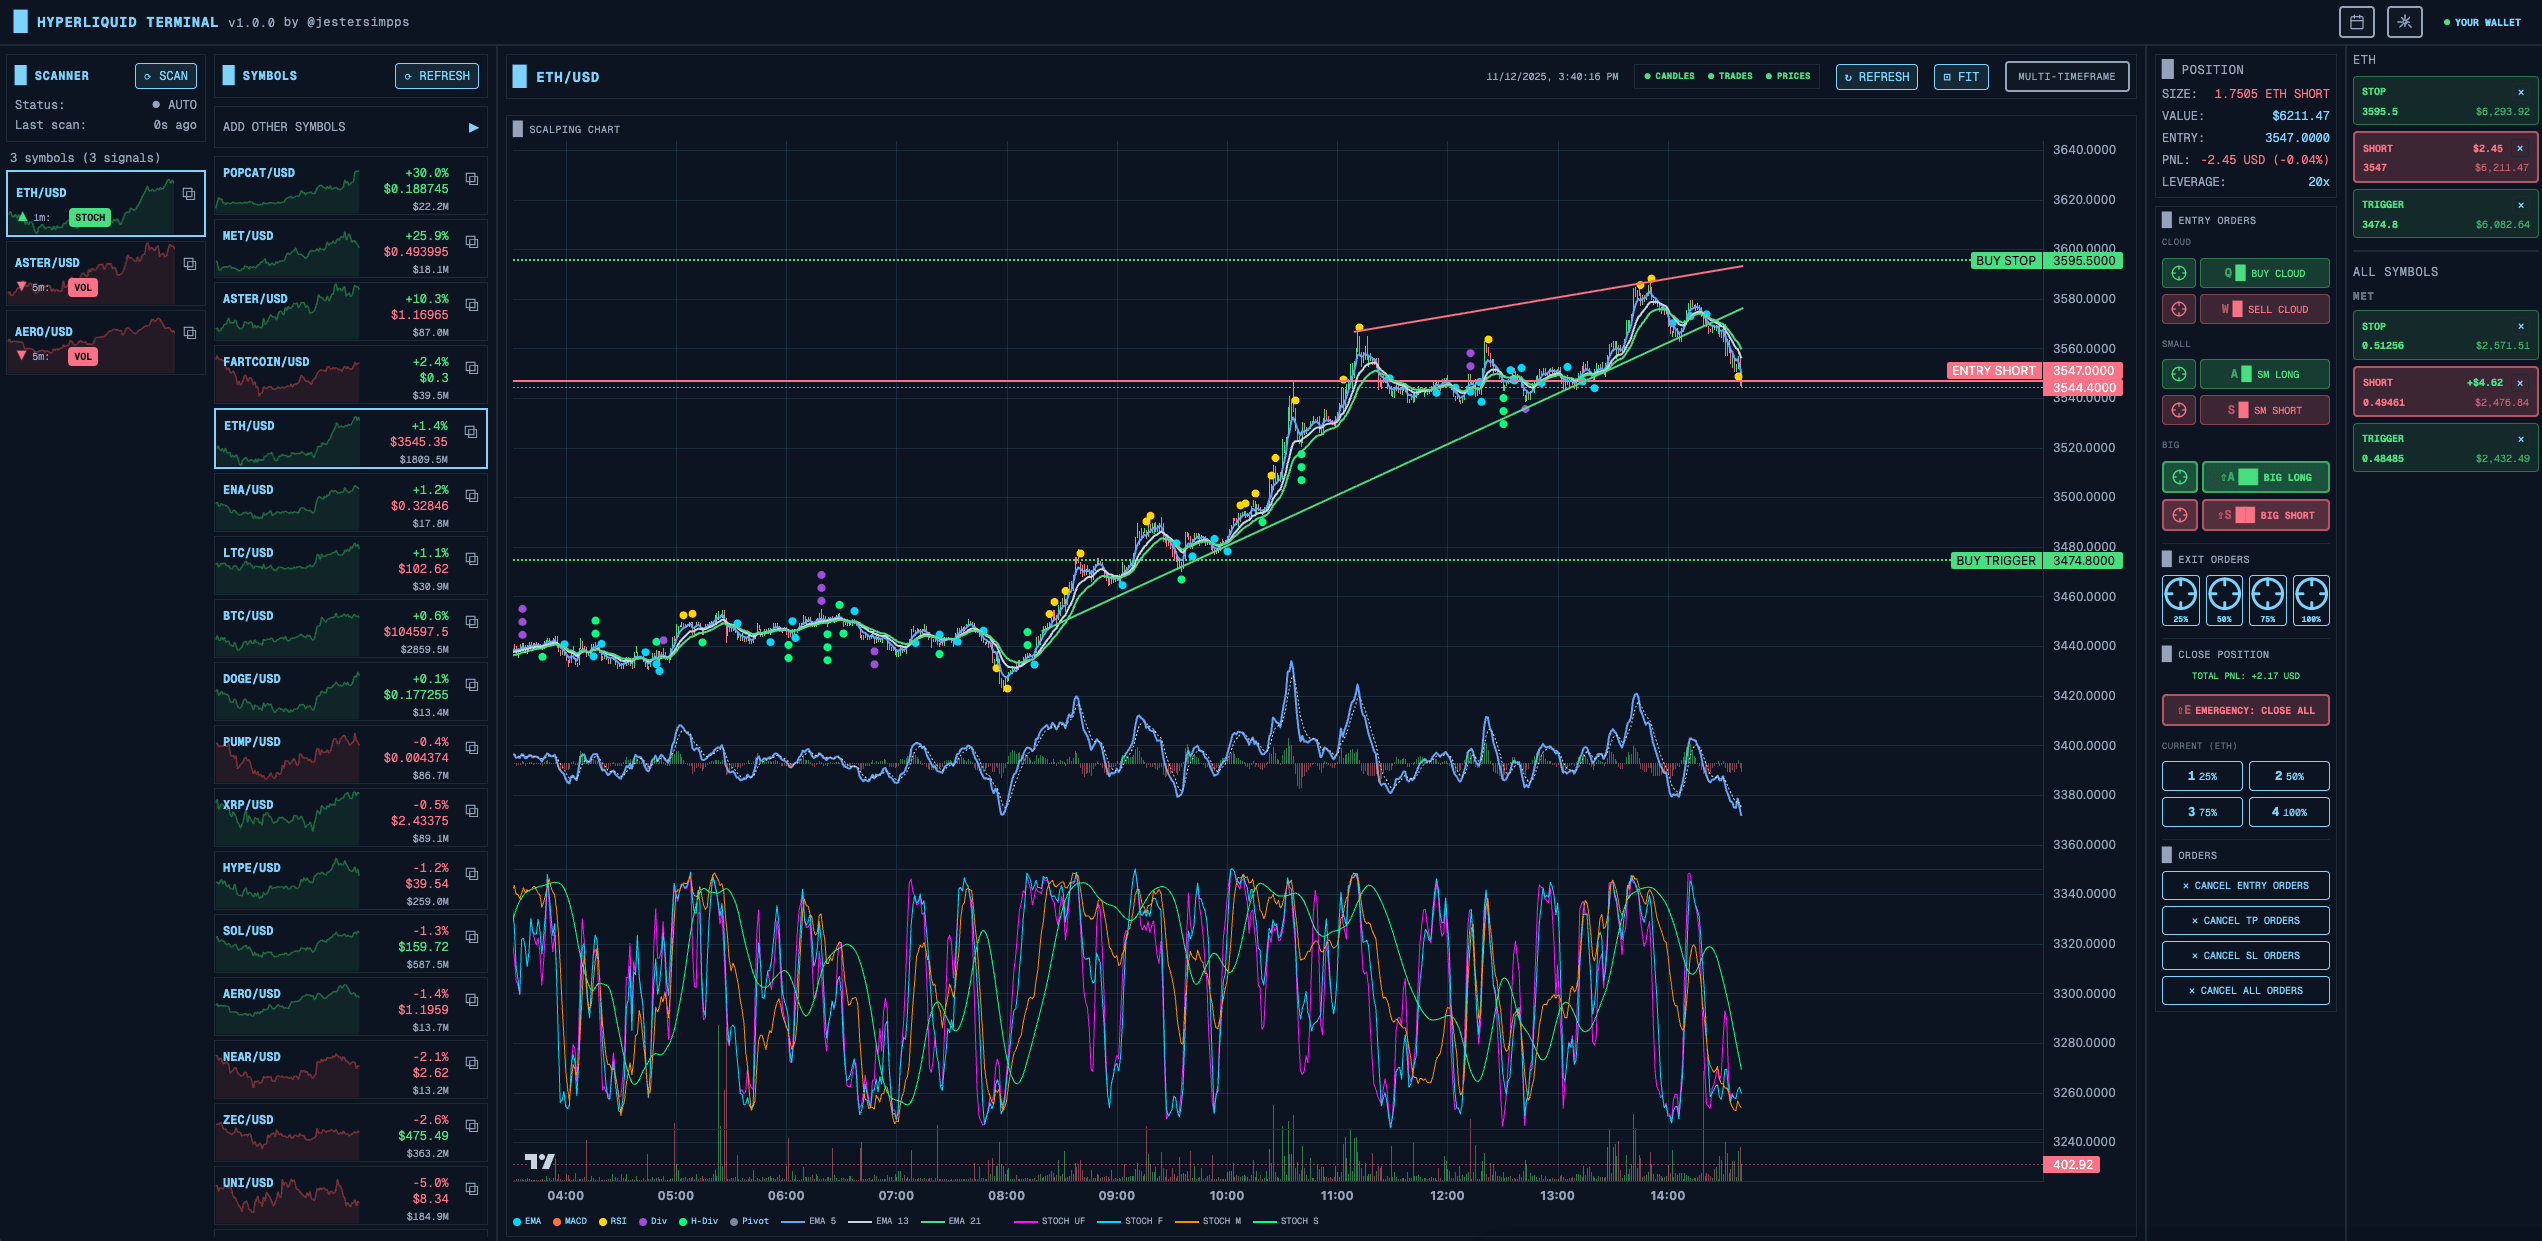
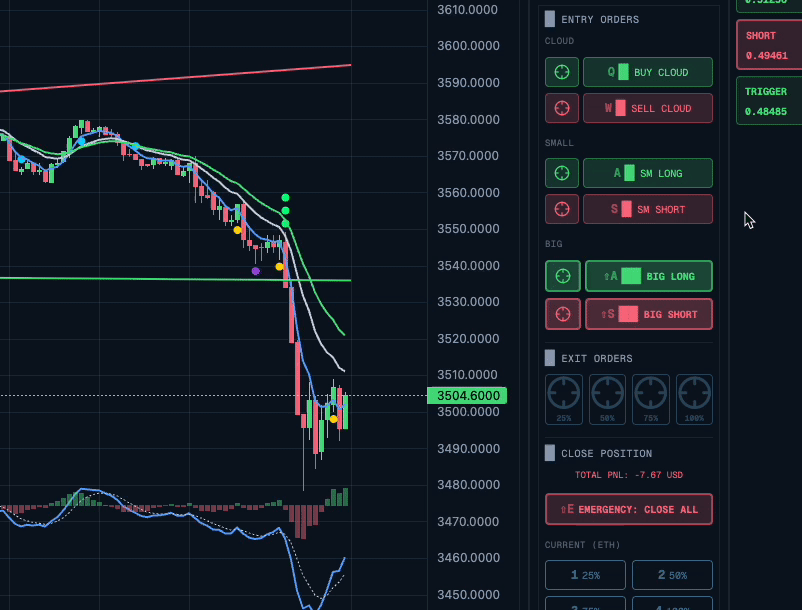
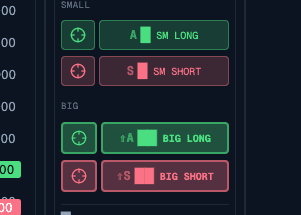
Order Entry Methods
Traders have different workflows. Some prefer clicking, others use hotkeys, and some want automated ladder orders. I implemented five distinct ways to enter orders.
Click-on-Chart Orders
Sometimes you want to place an order at a specific price level you see on the chart. I implemented a crosshair system that makes this intuitive:
Const handleChartClick = (params) => {if (!crosshairActive) return;const price = params.price;const isBuy = price < currentPrice;placeLimitOrderAtPrice({symbol,price,isBuy,percentage: settings.orderSizePercent});setCrosshairActive(false);};
Click below current price = buy limit order. Click above = sell limit order. Simple and intuitive.
Cloud Ladder Orders (DCA)
The signature feature. Instead of placing a single order, Cloud orders place 5 limit orders stacked at intervals below (for buys) or above (for sells) the current price.
Const buyCloud = async ({ symbol, currentPrice, priceInterval, percentage }) => {const ORDER_COUNT = 5;const TAKE_PROFIT_PERCENT = 2;const orders = [];for (let I = 0; I < ORDER_COUNT; I++) {const price = currentPrice - (priceInterval * I);const size = totalSize / ORDER_COUNT;orders.push({type: 'limit',side: 'buy',price,size,reduceOnly: false});// Auto TP at 2% profitorders.push({type: 'limit',side: 'sell',price: price * (1 + TAKE_PROFIT_PERCENT / 100),size,reduceOnly: true});}await Promise.all(orders.map(o => submitOrder(o)));};
The price interval is calculated from recent candle heights - the system adapts to current volatility.
Keyboard Shortcuts
For speed traders, reaching for the mouse is too slow. I mapped all common actions to hotkeys:
UseEffect(() => {const handleKeyDown = (e: KeyboardEvent) => {if (e.metaKey || e.ctrlKey) {switch (e.key) {case 'b':e.preventDefault();inverted ? SellCloud() : buyCloud();break;case 's':e.preventDefault();inverted ? BuyCloud() : sellCloud();break;case 'e':e.preventDefault();closePosition(25); // Close 25%break;}}};window.addEventListener('keydown', handleKeyDown);return () => window.removeEventListener('keydown', handleKeyDown);}, [inverted]);
Notice the inverted check - more on that later.
Optimistic Updates
Nobody wants to wait 500ms for an API response before seeing feedback. I implemented optimistic updates:
Const placeOrder = async (order) => {// 1. Immediately show in UIconst optimisticId = crypto.randomUUID();addOptimisticOrder({ ...order, id: optimisticId });showToast('Placing order...');try {// 2. Actually submit to exchangeconst result = await submitToHyperliquid(order);// 3. Replace optimistic with realremoveOptimisticOrder(optimisticId);addConfirmedOrder(result);playSuccessSound();} catch (error) {// 4. Rollback on failureremoveOptimisticOrder(optimisticId);showErrorToast(error.message);}};
The UI responds in under 100ms regardless of network latency.
Market Scanners
A trading terminal is only as good as its ability to find opportunities. I built 8 different scanner types that run in real-time across all symbols.
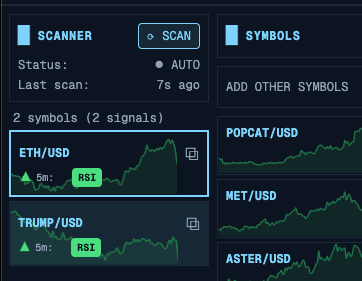
Scanner Architecture
Each scanner subscribes to candle data via WebSocket and runs analysis on every update:
// Shared WebSocket connection (singleton pattern)Const ws = getWebSocketService();// Subscribe to all symbols on multiple timeframesSymbols.forEach(symbol => {['1m', '5m', '15m', '1h'].forEach(timeframe => {ws.subscribeToCandles(symbol, timeframe, (candles) => {runScanners(symbol, timeframe, candles);});});});
Stochastic Scanner
The stochastic oscillator is great for finding oversold/overbought conditions. I implemented four variants with different periods:
Const scanStochastic = (candles, config) => {const variants = {ultraFast: { period: 5, smoothK: 2, smoothD: 2 },fast: { period: 9, smoothK: 3, smoothD: 3 },medium: { period: 14, smoothK: 3, smoothD: 3 },slow: { period: 21, smoothK: 5, smoothD: 5 }};const signals = [];Object.entries(variants).forEach(([name, params]) => {if (!config.variants[name].enabled) return;const stoch = calculateStochastic(candles, params);const current = stoch[stoch.length - 1];const previous = stoch[stoch.length - 2];// Bullish: K crosses above D in oversold zoneif (current.k > current.d &&previous.k <= previous.d &¤t.k < config.oversoldLevel) {signals.push({type: 'stochastic',variant: name,direction: 'bullish',strength: (config.oversoldLevel - current.k) / config.oversoldLevel});}});return signals;};
Divergence Detection
Divergences are powerful signals - when price makes a new low but RSI makes a higher low, it often signals a reversal. This required more complex logic:
Const detectDivergence = (candles, rsiValues) => {const pricePivots = findPivots(candles, 3);const rsiPivots = findPivots(rsiValues, 3);const divergences = [];const recentPriceLows = pricePivots.filter(p => p.type === 'low').slice(-5);for (let I = 1; I < recentPriceLows.length; I++) {const current = recentPriceLows[I];const previous = recentPriceLows[I - 1];// Price made lower lowif (current.price < previous.price) {const currentRsi = findClosestPivot(rsiPivots, current.index);const previousRsi = findClosestPivot(rsiPivots, previous.index);// RSI made higher low = bullish divergenceif (currentRsi.value > previousRsi.value) {divergences.push({type: 'regular_bullish',pricePoints: [previous, current],rsiPoints: [previousRsi, currentRsi],strength: calculateDivergenceStrength(...)});}}}return divergences;};
Performance Considerations
Running 8 scanners across 500+ symbols on 4 timeframes could easily kill browser performance. I used several optimization techniques:
Memoization with TTL:
Const memoizedCalculate = createMemoizedFunction(calculateStochastic,(candles, period) => `stoch-${candles.length}-${period}`,100, // max cache entries60000 // expire after 60s);
Debounced divergence detection:
// Don't recalculate on every tickConst debouncedDivergence = useDebouncedCallback(detectDivergence,1000 // Wait 1s after last update);
Virtual scrolling for results:
<FixedSizeListheight={600}itemCount={signals.length}itemSize={60}>{({ index, style }) => (<SignalItem signal={signals[index]} style={style} />)}</FixedSizeList>
Multi-Timeframe Analysis
One of the most powerful features is the multi-timeframe view. Seeing the same symbol across 1m, 5m, 15m, and 1h simultaneously helps identify confluence.
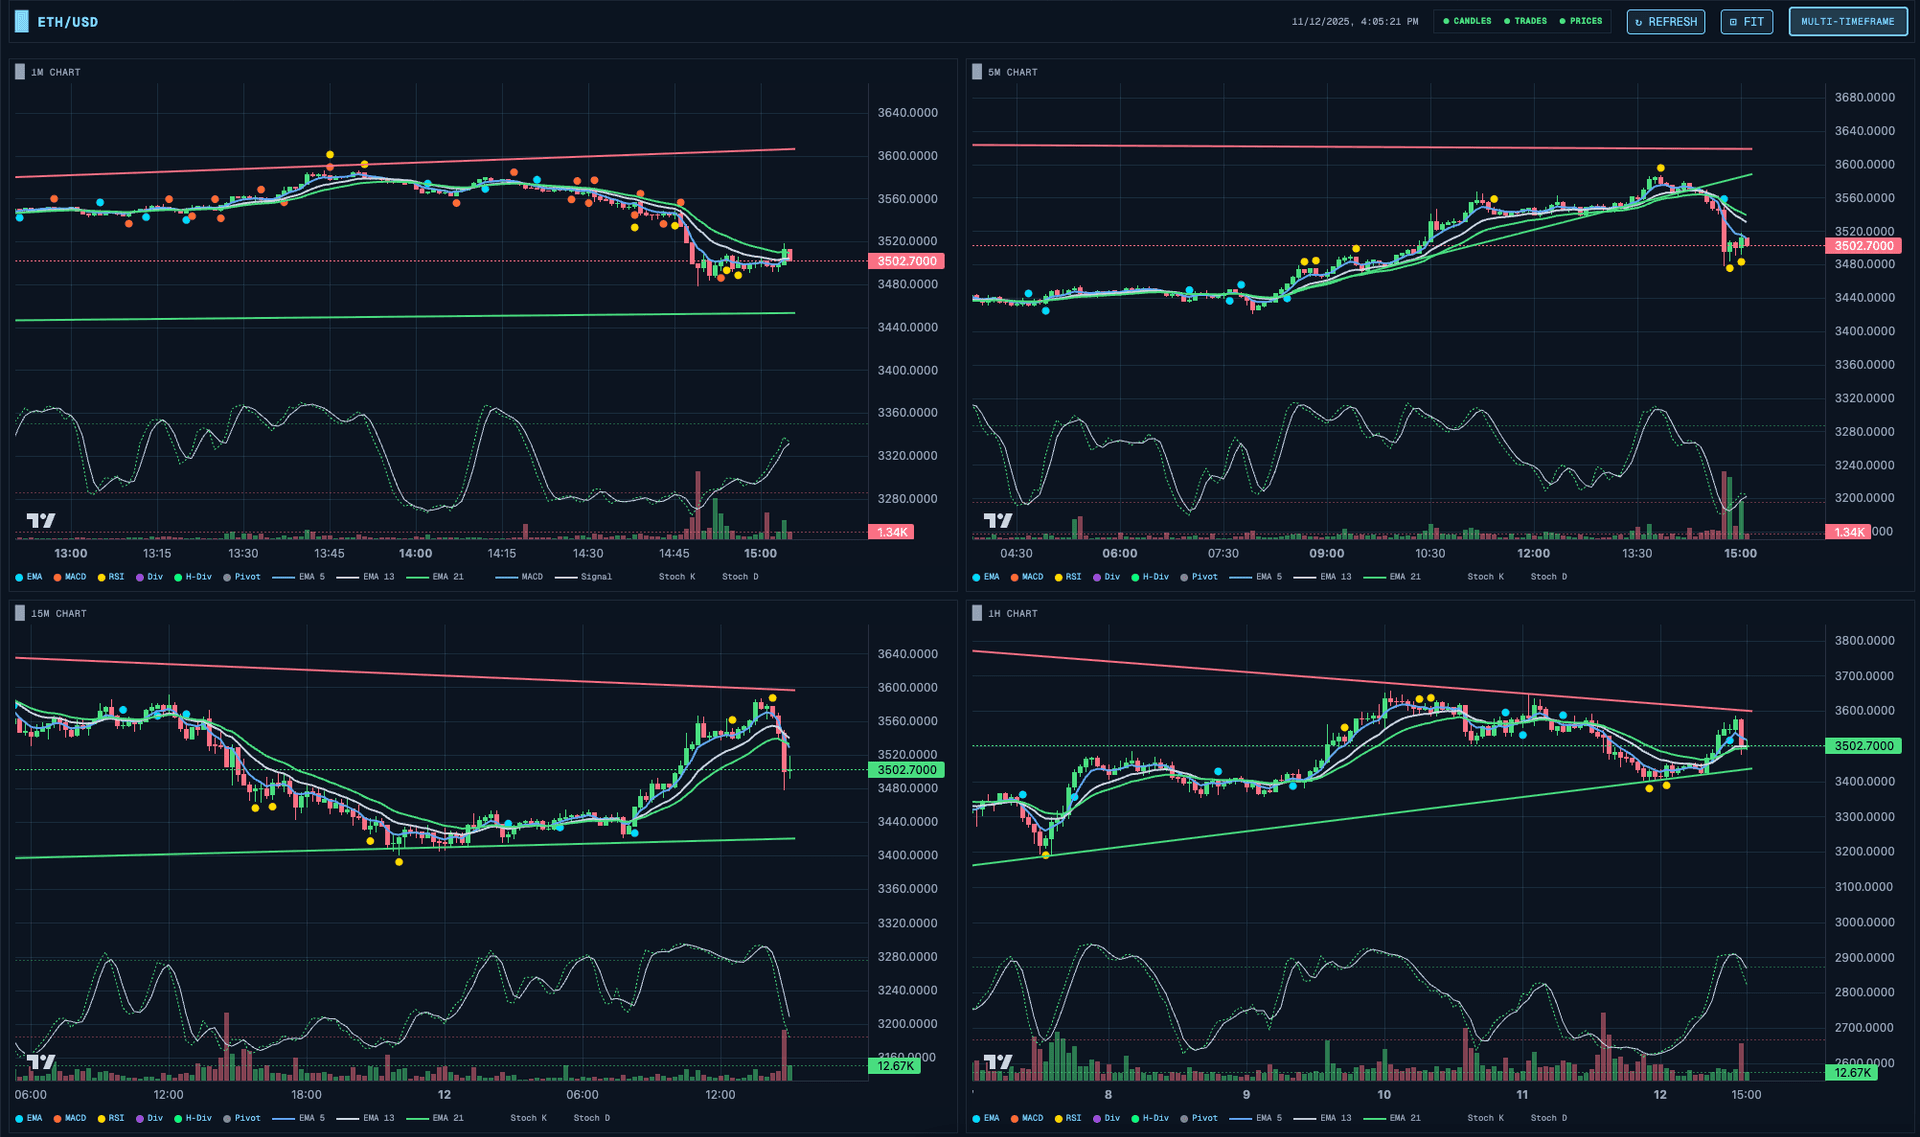
All charts are synchronized - when you zoom or pan one chart, all others follow. This is achieved through a shared chart sync store:
Const useChartSyncStore = create((set) => ({timeRange: null,setTimeRange: (range) => set({ timeRange: range }),}));// In each chart componentUseEffect(() => {const unsubscribe = useChartSyncStore.subscribe((state) => state.timeRange,(range) => {if (range) chart.timeScale().setVisibleRange(range);});return unsubscribe;}, [chart]);
Support and Resistance Lines
Automated trendline detection is one of those features that sounds simple but has surprising depth. I implemented three complementary approaches.
Pivot-Based Trendlines
The most intuitive approach: find pivot points and draw lines through them.
Const detectPivots = (candles, strength = 3) => {const pivots = [];for (let I = strength; I < candles.length - strength; I++) {const current = candles[I];let isHigh = true;for (let j = I - strength; j <= I + strength; j++) {if (j !== I && candles[j].high >= current.high) {isHigh = false;break;}}if (isHigh) {pivots.push({ index: I, price: current.high, type: 'high' });}// Same logic for lows...}return pivots;};
Envelope Validation
A support line that gets violated isn't useful. I validate lines against all candles:
Const findBestSupportLine = (pivots, candles) => {let bestLine = null;let bestScore = -Infinity;for (let I = 0; I < pivots.length - 1; I++) {for (let j = I + 1; j < pivots.length; j++) {const line = createLine(pivots[I], pivots[j]);let touches = 0;let violations = 0;candles.forEach((candle, idx) => {const linePrice = getLineValueAt(line, idx);const tolerance = linePrice * 0.002;if (candle.low < linePrice - tolerance) {violations++;} else if (Math.abs(candle.low - linePrice) < tolerance) {touches++;}});const score = touches * 10 - violations * 100;if (score > bestScore && violations === 0 && touches >= 3) {bestScore = score;bestLine = line;}}}return bestLine;};
The key insight: a support line with zero violations is far more valuable than one with many touches but some violations.
Trade Analytics
Tracking performance is essential for improving as a trader. Hyperscalper provides daily and monthly P&L overviews:
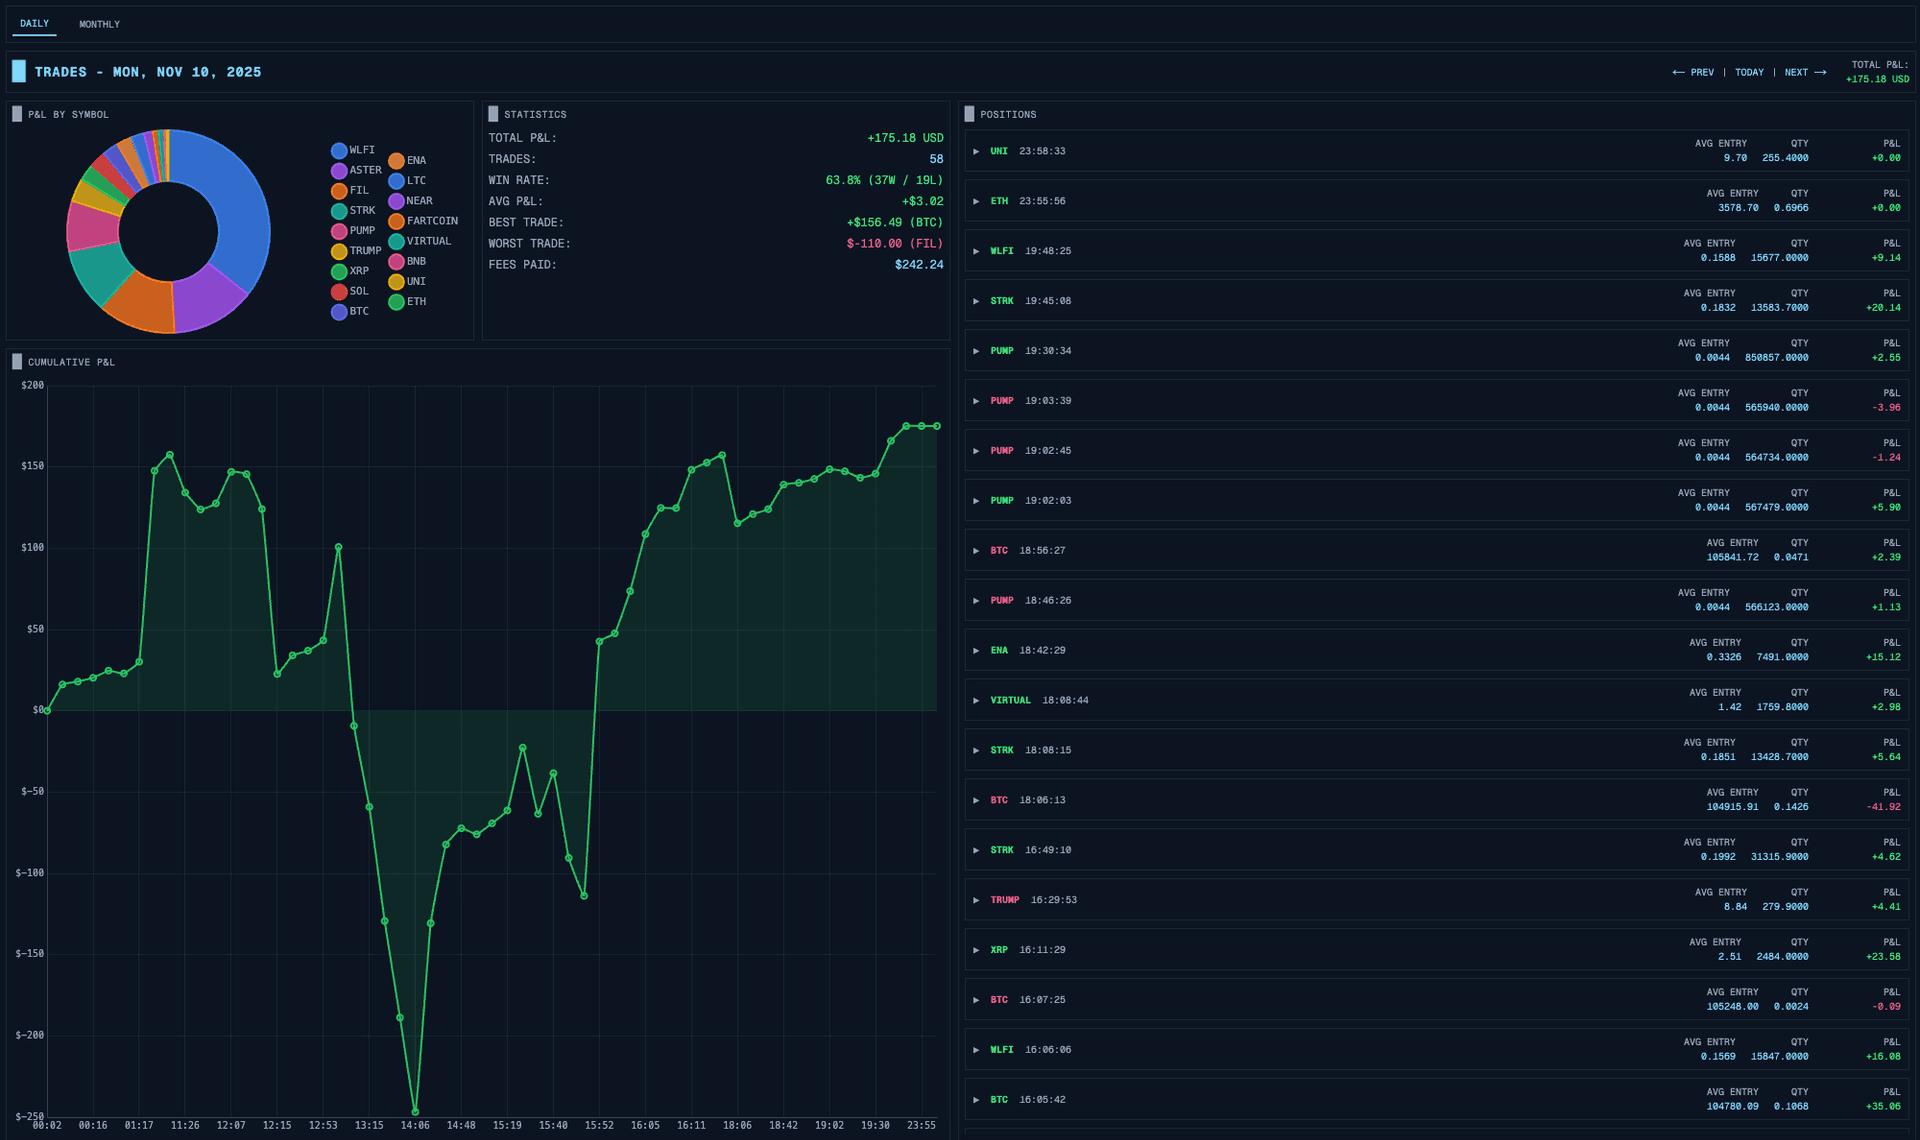
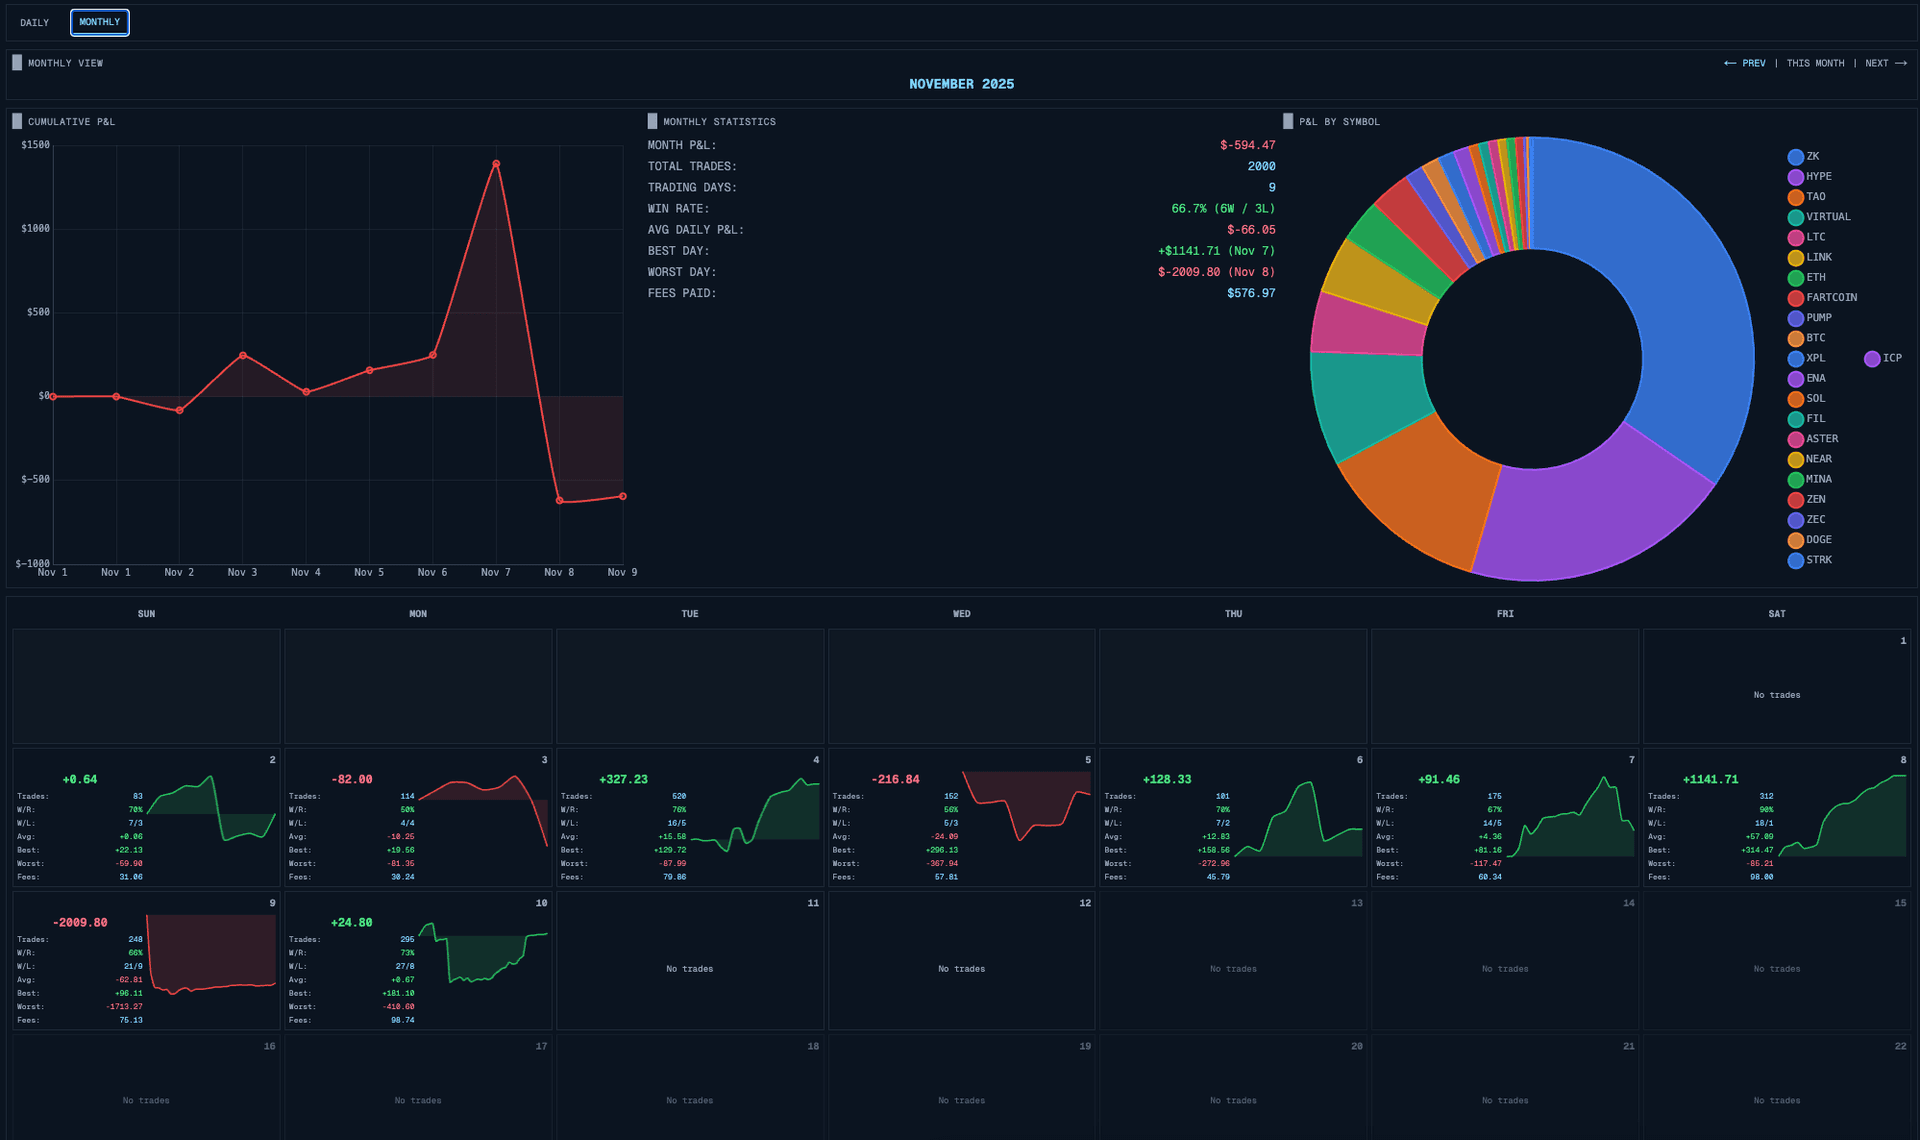
All this data comes directly from Hyperliquid's API - no backend storage needed.
The Inverted Mode
Here's a feature born from real trading experience: inverted mode.
When you're a short-biased trader, the standard UI is confusing. Green means price went up (bad for shorts), red means it went down (good for shorts). Bullish signals are bearish opportunities.
Inverted mode flips everything:
Const getSignalColor = (signal, inverted) => {const isBullish = signal.direction === 'bullish';if (inverted) {// Bullish signal = shorting opportunity = show as "good" (green)return isBullish ? Colors.bearish : colors.bullish;}return isBullish ? Colors.bullish : colors.bearish;};
Candle colors, signal indicators, even the support/resistance label semantics flip. A short trader sees the same patterns as a long trader, just interpreted correctly for their bias.
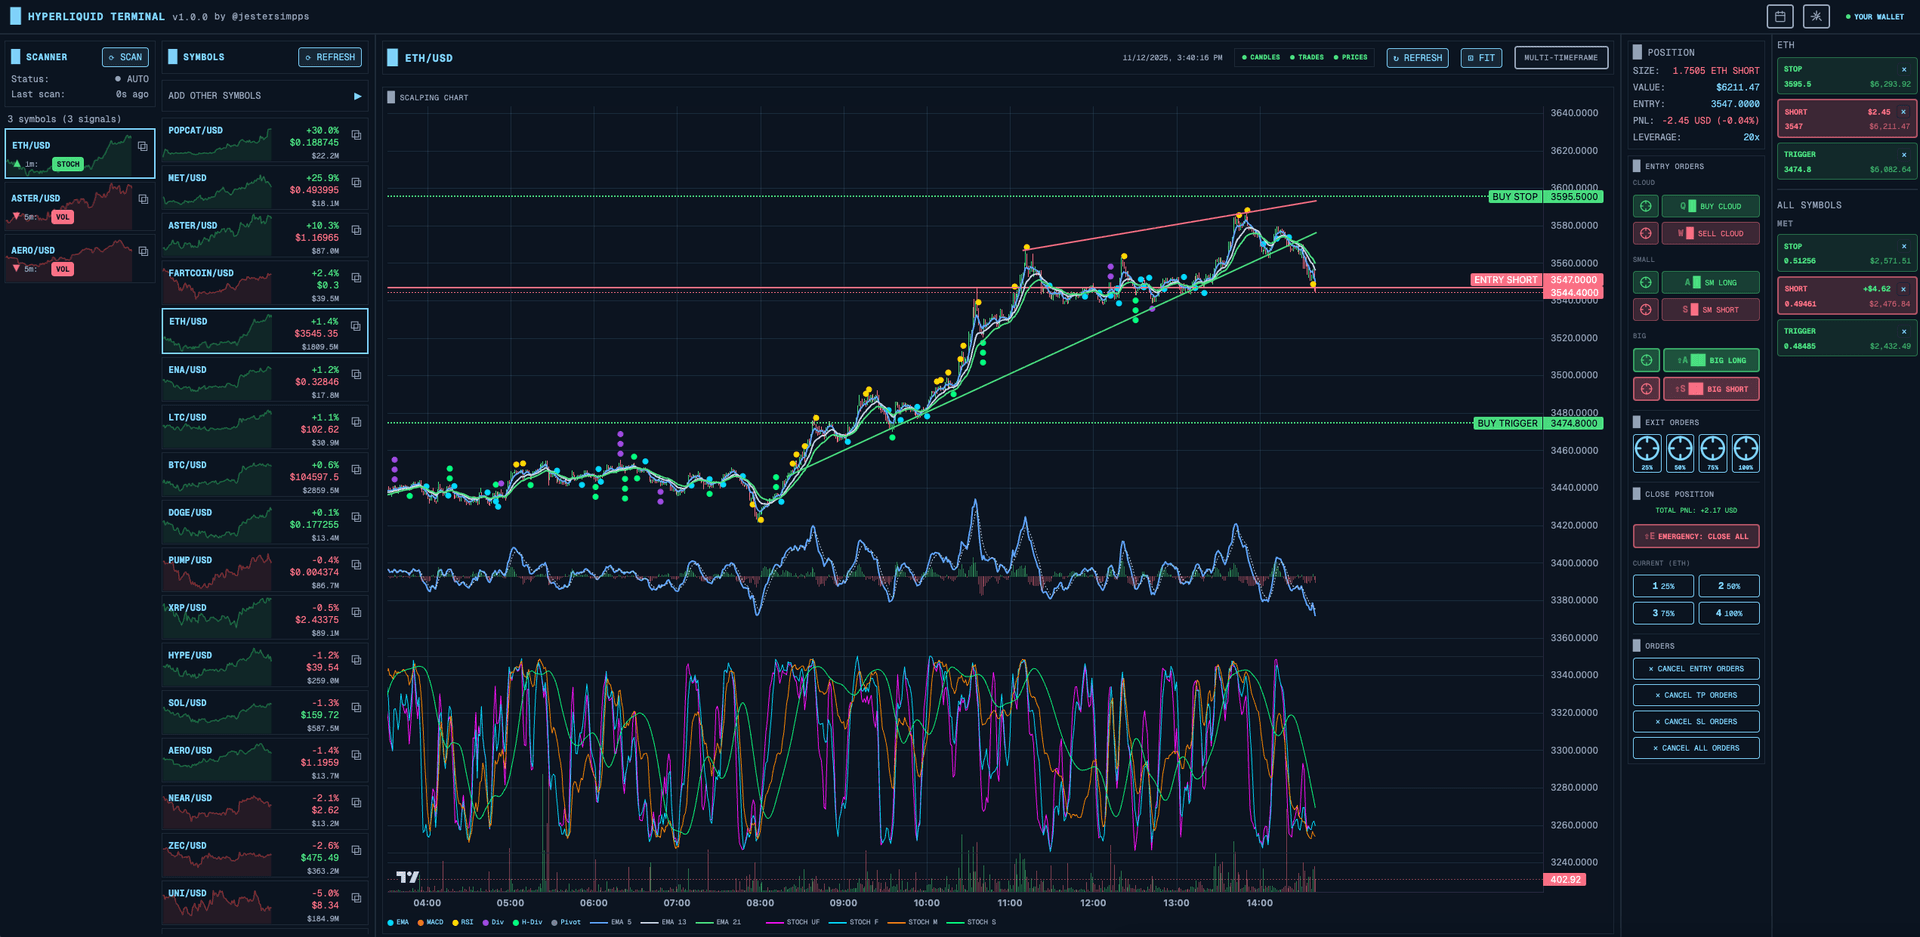
Multi-Monitor Support
Professional traders often use multiple monitors. Hyperscalper supports detaching charts into separate windows:
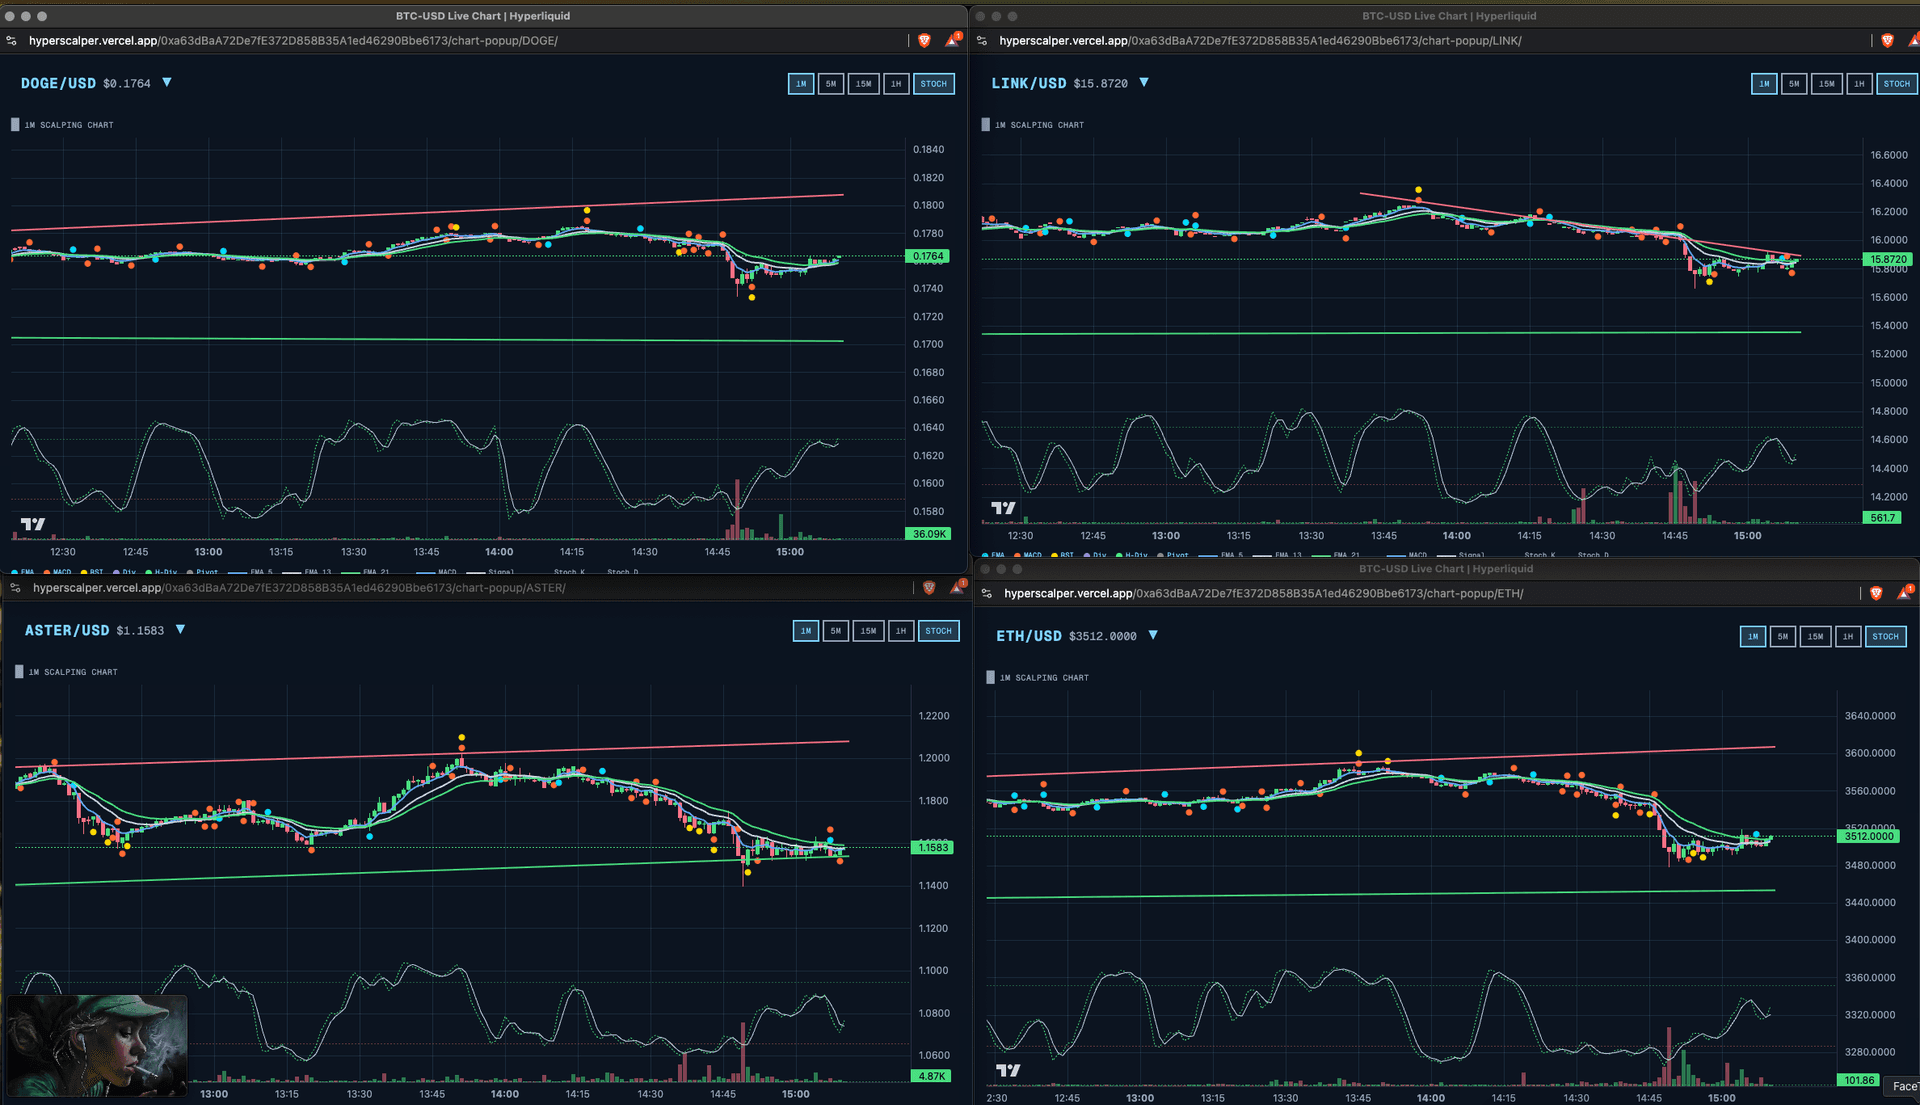
Each popup window maintains its own WebSocket connection and syncs state with the main window via BroadcastChannel:
Const channel = new BroadcastChannel('hyperscalper-sync');// Main window broadcasts state changesChannel.postMessage({ type: 'POSITION_UPDATE', data: positions });// Popup windows listenChannel.onmessage = (event) => {if (event.data.type === 'POSITION_UPDATE') {setPositions(event.data.data);}};
State Management with Zustand
With 20+ stores managing different domains, I needed lightweight state management. Redux felt like overkill. I chose Zustand:
Const useTradingStore = create<TradingStore>((set, get) => ({orders: [],positions: [],addOrder: (order) => set((state) => ({orders: [...state.orders, order]})),closePosition: async (symbol, percentage) => {const position = get().positions.find(p => p.symbol === symbol);if (!position) return;const size = position.size * (percentage / 100);await submitMarketOrder({symbol,side: position.side === 'long' ? 'sell' : 'buy',size,reduceOnly: true});}}));
Each store is focused on one domain: trading, orders, positions, candles, scanner, settings, etc. Components subscribe to exactly what they need.
Lessons Learned
Building Hyperscalper taught me several things:
1. Client-side can be enough. For applications where trust matters, eliminating the backend isn't just possible - it's preferable.
2. Optimistic updates are essential. In trading, 500ms of latency feels like an eternity. Show feedback immediately, reconcile later.
3. Multiple input methods matter. Different traders have different workflows. Some click, some use hotkeys, some want automation. Support them all.
4. Performance optimization is mandatory. Running technical analysis on 500 symbols in real-time requires careful attention to memoization, debouncing, and virtual rendering.
5. Inverted thinking helps. Building for short traders forced me to question assumptions about what "up" and "good" mean. The result is a more flexible system.
Hyperscalper is live at hyperscalper.vercel.app if you want to try it out. The code demonstrates that professional-grade trading tools can run entirely in the browser - no backend required.
Stay Updated
Get notified about new posts on automation, productivity tips, indie hacking, and web3.
No spam, ever. Unsubscribe anytime.